A Rare G4 Severe Geomagnetic Warning Threatens Global Satellites and Power Grids
NOAA space weather forecasters track an active sunspot flare eruption driving severe plasma streams directly toward Earth.
SWPC Issues Urgent Alert for Active Sunspot Flare Eruption
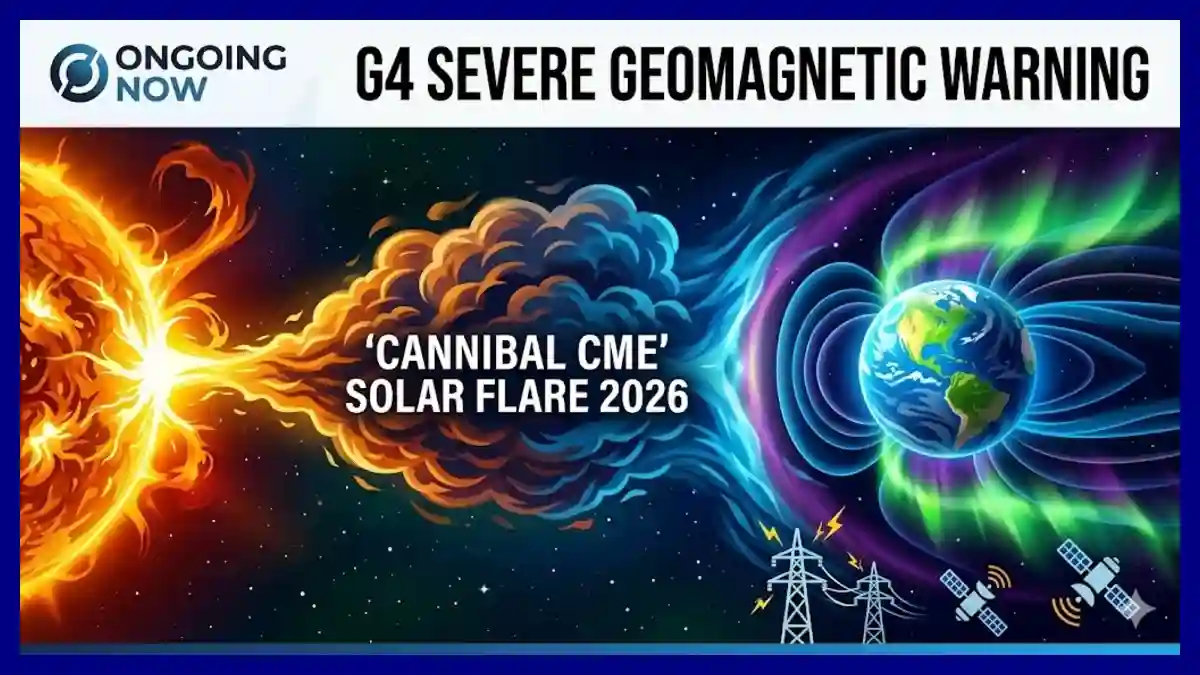
Forecasters at the NOAA Space Weather Prediction Center confirmed that a highly volatile magnetic structure within an active sunspot group underwent a sustained period of instability. This localized magnetic reconnection event triggered a powerful X-class solar flare, releasing an immediate pulse of electromagnetic radiation that ionized the upper layers of Earth’s atmosphere.
The primary consequence of this active sunspot flare eruption was the generation of a high-energy coronal mass ejection (CME). This magnetized plasma cloud escaped the solar corona at speeds exceeding 1,500 kilometers per second, setting a direct trajectory toward Earth’s orbital plane.
Satellite telemetry indicates that the solar atmosphere remains highly destabilized, with secondary flares continuously registering on orbital sensors. Space weather agencies globally have synchronized their tracking systems to monitor potential follow-on eruptions from the same active region.
+-----------------------------------------------------------------------+
|                 SWPC SOLAR DISTURBANCE ALERT SUMMARY                  |
+----------------------+------------------------------------------------+
| Parameter            | Observed Operational Status                    |
+----------------------+------------------------------------------------+
| Flare Classification | X-Class (Sustained Ionization Pulse)          |
| Ejection Velocity    | > 1,500 km/s (Estimated Profile)               |
| Target Region        | Earth Orbital Plane Terrestrial Intersection   |
| Current System Alert | G4 Severe Geomagnetic Warning Active           |
+----------------------+------------------------------------------------+
Analyzing the Mechanics of a Cannibal CME Solar Flare 2026 Event
The current space weather emergency is compounded by a complex hydrodynamic interaction known as a cannibal CME solar flare 2026 event. This occurs when an initial, slower coronal mass ejection is overtaken by a subsequent, high-velocity plasma cloud originating from the same sunspot cluster.
As the secondary, faster CME sweeps through interplanetary space, it plows into the slower moving plasma ahead of it. This process compresses the magnetic fields of both clouds, generating a highly intensified shock front with an elevated internal magnetic field strength.
When this consolidated plasma mass collides with Earth’s magnetosphere, the energy transfer is significantly more efficient and destructive than that of isolated ejections. The combined kinetic energy and magnetic density maximize the distortion of Earth’s geomagnetic field lines.
Solar Wind Stream Velocity Tracker Details Extreme Plasma Speeds
Data streaming from the Deep Space Climate Observatory (DSCOVR) and the Advanced Composition Explorer (ACE) satellites reveals a stark profile of the oncoming solar wind. The solar wind stream velocity tracker has registered a baseline jump from a nominal 400 kilometers per second to over 1,200 kilometers per second within hours.
Alongside the velocity spike, the proton density within the solar wind has surged exponentially, indicating a heavily compacted plasma front. The interplanetary magnetic field orientation has shifted sharply southward, a alignment that allows solar plasma to connect directly with Earth’s magnetic field.
Space environment technicians utilize these real-time velocity metrics to calculate the precise arrival window of the core shock front. The elevated velocity shortens the propagation time from the Sun to Earth, compressing the preparatory window for critical infrastructure operators.
+-----------------------------------------------------------------------+
|              SOLAR WIND STREAM VELOCITY TRACKER METRICS               |
+-----------------------+-----------------------+-----------------------+
| Measurement Type      | Baseline State        | Peak Shock Profile    |
+-----------------------+-----------------------+-----------------------+
| Plasma Stream Velocity| 400 km/s              | > 1,200 km/s          |
| Proton Density        | Low/Nominal           | Exponential Surge     |
| Magnetic Alignment    | Variable              | Strong Southward (Bz) |
+-----------------------+-----------------------+-----------------------+
G4 Severe Geomagnetic Warning Implications for Planetary Infrastructure
The transition from a standard watch to a formal G4 severe geomagnetic warning reflects the high probability of widespread systemic impacts. At this operational threshold, power grid operators must manage significant induced currents that can saturate transformer cores and cause voltage instability.
In low-Earth orbit, the sudden influx of solar energy heats and expands the upper atmosphere, substantially increasing satellite drag. Operators must execute defensive maneuvering protocols to maintain orbital altitude and prevent premature orbital decay for critical satellite constellations.
Additionally, satellite-based navigation systems, including GPS and Galileo, face severe signal degradation. The highly irregular ionosphere bends and delays radio signals, leading to positioning errors that impact maritime, aviation, and autonomous transport operations worldwide.
Assessing Regional Risks and G3 Geomagnetic Storm Effects
While the G4 warning represents the peak expected severity, the prolonged nature of this solar event means that prolonged G3 geomagnetic storm effects will persist across multiple orbital rotations. These secondary effects include intermittent high-frequency radio blackouts, particularly across the polar and high-latitude communication pathways.
Commercial aviation routes crossing polar regions are being actively rerouted to lower latitudes to avoid communication dropouts and mitigate radiation exposure risks for flight crews. Marine communication frequencies are similarly experiencing prolonged periods of high static and signal fading.
Regional power distributors have activated emergency mitigation plans, which include decoupling vulnerable transmission lines and balancing reactive power loads. These precautionary measures aim to insulate large transmission networks from catastrophic cascading failures.
Aurora Ovation Model 30 Minute Indicates Low Latitude Visibility
For the public, the most visible indicator of this space weather event is the dramatic expansion of the auroral ovals. The aurora ovation model 30 minute forecasting tool shows the auroral injection zone shifting deep into middle latitudes, far beyond traditional polar boundaries.
The model predicts that high-intensity green and red auroral displays will be visible across vast swaths of Europe, North America, and the southern reaches of Australia and New Zealand. This expansion is driven by the severe compression of the magnetosphere, which forces solar particles deeper into the atmosphere.
+-----------------------------------------------------------------------+
|                   AURORAL OBSERVATION EXPANSION ZONE                  |
+-----------------------+-----------------------+-----------------------+
| Latitudinal Zone      | Standard Conditions   | G4 Storm Conditions   |
+-----------------------+-----------------------+-----------------------+
| High Latitudes        | Active/Visible        | Extreme Saturation    |
| Mid-Latitudes         | Rare Visibility       | Widespread Visibility |
| Low Latitudes         | No Visibility         | Horizon Visibility    |
+-----------------------+-----------------------+-----------------------+
Scientists emphasize that while the aurora presents a compelling visual phenomenon, its brightness corresponds directly to the level of electrical current surging through the upper atmosphere. The same currents generating the visual displays are those interacting with power lines and pipelines on the ground.
Solar Maximum Sunspot Region Dynamics Fuel Ongoing Instability
The ongoing solar maximum sunspot region, designated as a primary area of concern by international heliophysicists, continues to exhibit complex, delta-class magnetic configurations. These regions feature opposing magnetic polarities tightly packed within the same sunspot cluster, storing immense amounts of potential energy.
Statistical modeling of this specific sunspot group indicates a high probability of additional M-class and X-class flare events over the next 72 hours. The region’s position on the solar disk is currently geo-effective, meaning any further ejections will be directed squarely at Earth.
Heliophysicists utilize advanced coronal magnetograms to track the twisting and shearing of these magnetic loops. As long as these configurations remain unstable, the global space weather community must maintain a heightened state of operational readiness.
Technological Mitigations Against Solar Wind Vulnerabilities
Modern space and terrestrial infrastructure employs a variety of engineering safeguards to withstand the impacts highlighted by the space weather prediction center alert. Satellites can be placed into safe modes, orienting sensitive optical instruments away from the incoming particle stream and powering down non-essential electronics.
On the ground, specialized ground systems dump excess electrical charge from power transmission grids into sacrificial grounding fields. Gas and oil pipeline operators adjust cathodic protection voltages to counteract the geomagnetically induced currents that accelerate structural corrosion during intense storms.
These collective technological defenses are tested continuously during the peak phases of the solar cycle. The collaborative data sharing between international space agencies ensures that accurate predictive models give critical sectors the time required to implement these protective protocols.
Stay sharp with Ongoing Now!
Source and Data Limitations: This report is compiled using public data products, alerts, and solar imagery provided by the NOAA Space Weather Prediction Center (SWPC), the NASA Moon to Mars Space Weather Analysis Office, and the European Space Agency (ESA) Space Weather Service Network. Telemetry data from the DSCOVR and ACE spacecraft were utilized for real-time solar wind velocity measurements. Observations correspond to active sunspot developments recorded during June 2026. Forecasts and model outputs, including the Aurora Ovation 30-minute model, are subject to rapid revisions based on incoming interplanetary shock front measurements. Speculative claims regarding long-term power grid collapse or unverified infrastructure damage have been excluded from this report in accordance with verified scientific consensus.