Twin Cities Winter Storm Warning: Potential for Historic Snowfall
National Weather Service issues Winter Storm Warning for Minneapolis and St. Paul as a powerful "Colorado Low" targets the Upper Midwest with heavy accumulations and high winds.
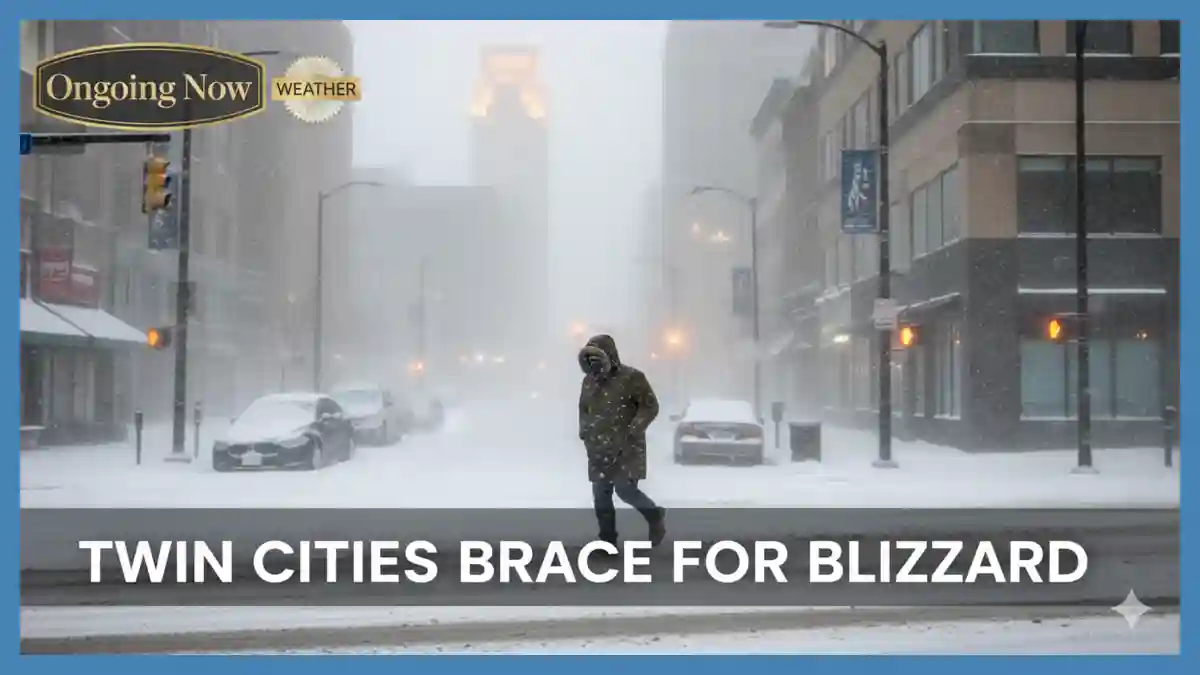
The National Weather Service (NWS) has officially upgraded the Twin Cities snow totals March 2026 outlook, placing Minneapolis and St. Paul under a Winter Storm Warning effective from Saturday evening through Monday morning. This significant weather event is driven by a powerful Colorado low impact Minnesota, which is expected to deliver a “monster” band of heavy, wet snow across the central and southern regions of the state. Meteorologists are currently tracking a transition from the light rain-snow mix observed on Friday to a high-intensity snowfall event beginning late Saturday night, with accumulation rates potentially reaching 2–3 inches per hour. As of Friday afternoon, verified forecasts from the NWS blizzard warnings indicate that while northern Minnesota bore the brunt of a separate system on March 12-13, this incoming storm is squarely focused on the Twin Cities metro, necessitating immediate community preparedness for “very difficult to impossible” travel conditions and possible Minneapolis winter storm emergency protocols.
Reliable data from the North Central River Forecast Center and the National Oceanic and Atmospheric Administration (NOAA) suggest this system possesses an unusual amount of moisture for mid-March. Forecasters like Brandon Buckingham of AccuWeather and the team at the NWS Twin Cities office have noted that this could be the most significant snowfall of the season for the region. Currently, Twin Cities weather alerts highlight the risk of whiteout conditions due to wind gusts of up to 40 mph accompanying the snow. This report analyzes the atmospheric mechanics, specifically the dendritic growth zone, that will dictate final snow depth and the status of the regional electrical grid.
Evolution of the March 2026 Winter Storm Track
The current meteorological setup involves a deepening area of low pressure currently organizing over the central Rockies—a classic “Colorado Low.” Unlike the “clippers” that typically bring light, powdery snow, this system is tapping into a significant moisture plume from the Gulf of Mexico, which is then being forced upward by a sharp arctic front descending from Canada. This collision of air masses is expected to result in a “bomb cyclone” effect, where the central pressure of the storm drops rapidly, intensifying both precipitation and wind speeds.
For residents tracking the St Paul snow accumulation forecast, the most critical window begins after midnight on Sunday. According to the NWS, a broad area of 10 to 16 inches is “likely,” with a higher-end scenario of 15 to 22 inches possible if the heavy snow bands remain stationary over the metro area. Localized totals in western Wisconsin could even approach two feet.
Key Forecast Data: Twin Cities Impact
| Metric | Forecasted Value (Metro) | Peak Timing |
| Total Snowfall | 12–18 inches (locally higher) | Sunday Morning |
| Snowfall Rate | 1–3 inches per hour | 2:00 AM – 10:00 AM Sunday |
| Wind Gusts | 35–45 mph | Sunday Afternoon |
| Visibility | Less than 1/4 mile | During peak snow rates |
| Temperature | 28°F – 32°F (Wet Snow) | Sunday All Day |
Scientific Analysis: The Role of the Dendritic Growth Zone
The extraordinary heavy snowfall rate science behind this storm is linked to a layer of the atmosphere known as the dendritic growth zone (DGZ). This is a specific vertical layer where temperatures range between $-12°C$ and $-16°C$. When saturated air is lifted through this zone, water vapor deposits directly onto ice crystals, forming “dendrites”—the classic, large, six-armed snowflakes that stack efficiently and lead to rapid accumulation.
“The efficiency of this storm is tied to the depth of the dendritic growth zone and the strength of the vertical motion within it,” notes a recent technical discussion from the NWS Twin Cities. “When you have strong lifting occurring right in that $-12°C$ to $-16°C$ sweet spot, you get those massive flakes that can bury a driveway in a matter of hours.”
Because the snowflake formation temperature profile for this storm involves relatively warm surface temperatures (near freezing), the snow will be high-density and “heavy.” While this makes for great snowball-making, it significantly increases the risk of infrastructure damage. The weight of this “heart attack snow” on power lines and tree branches, combined with 40 mph winds, is the primary driver for the winter storm power failure updates currently being issued by local utilities.
Utility Status and Infrastructure Readiness
As of March 13, 2026, Xcel Energy report outage teams are already on high alert. Following high wind gusts on Friday that caused scattered outages across Anoka and Dakota counties, the utility has pre-positioned additional field crews to handle the expected surge in service disruptions on Sunday.
Minneapolis Power Outage Status (March 13 Update)
The live electricity map Minnesota currently shows minor, localized outages affecting fewer than 1,000 customers, mostly due to residual wind damage from Friday morning. However, the heavy snow load expected Sunday poses a much greater threat.
Xcel Energy Customer Service: Residents are urged to report outages via the Xcel mobile app or by calling 1-800-895-1999.
St Paul Utility Restoration Time: Officials caution that if widespread transmission lines are affected by heavy snow and wind, restoration times may be extended as crews struggle to navigate impassable roads.
Emergency Resource Availability: Emergency generator rentals Minneapolis providers are reporting high demand; residents should ensure any portable generators are operated at least 20 feet from the home to prevent carbon monoxide poisoning.
Comparative Analysis: March Storms in Perspective
March is historically the snowiest month for Minnesota, and this 2026 event bears striking similarities to the “Mega-Storms” of 1951 and 1985. The meteorological cause of blizzards in late winter often involves these high-moisture systems because warmer air can hold more water vapor than the dry, brittle air of January.
| Storm Event | Date | Total Snowfall (MSP) | Peak Wind Gust |
| Current Forecast | March 14-16, 2026 | 12–18″ (Projected) | 45 mph |
| The “Halloween” Variant | March 1985 | 14.7″ | 40 mph |
| Mid-March Blizzard | March 1951 | 10.0″ | 50 mph |
Caveat: Historical comparisons are based on preliminary model tracks; shift in the “low” center by even 50 miles could significantly alter these totals.

Analysis: Why This Matters for Public Safety
This is not merely a “snow event”; it is a complex meteorological phenomenon that threatens both mobility and power stability. The combination of high-density snow and wind is the “worst-case scenario” for the electrical grid.
What the Models Show:
The ECMWF (European) and GFS (American) models have largely converged on a track that brings the center of the low through northern Iowa. This is the “sweet spot” for heavy snow in the Twin Cities. While there was earlier disagreement regarding a transition to rain, the latest soundings show a deep enough cold layer to keep the precipitation almost entirely frozen for the duration of the storm.
Safety Planning Measures:
Travel: Delta Airlines has already issued travel waivers for MSP International Airport for Saturday and Sunday. Residents should avoid the roads after 9:00 PM Saturday.
Health: Due to the “heavy” nature of the snow, residents with heart conditions are advised to use extreme caution or seek assistance when shoveling.
Supplies: Check current outage maps by zip code and ensure you have at least 72 hours of food, water, and flashlight batteries.
Evidence-Based Weather Insights: The DGZ and Accumulation
Understanding how snow forms DGZ helps explain why a forecast might jump from 6 inches to 16 inches in a single update. If the “lift” in the atmosphere is perfectly aligned with the dendritic growth zone, the “snow-to-liquid ratio” increases. Instead of 10 inches of snow for every 1 inch of rain, the atmosphere might produce 15 or 20 inches of snow for that same amount of moisture.
The vertical motion snow production in this specific storm is being enhanced by “frontogenesis”—a tightening of the temperature gradient that acts like a regional vacuum, sucking moisture upward and cooling it rapidly. This is the atmospheric science of winter storms at its most potent. As the snow crystals grow through vapor deposition, they become heavy enough to fall rapidly, creating the 2-inch-per-hour rates that blind drivers and bury vehicles.
As we move into Saturday night, the primary focus will shift from the St Paul snow accumulation forecast to the real-time winter storm power failure updates. The integration of scientific forecasting and utility preparedness will be the determining factor in how quickly the Twin Cities recovers from this mid-March surge.
Stay sharp with Ongoing Now!
Related Coverage: Analyzing the Kankakee Tornado Path Map and Storm Impacts
Source and Data Limitations: This report is based on National Weather Service (NWS) Twin Cities briefings, NOAA/WPC probabilistic snowfall maps, and Xcel Energy newsroom updates as of March 13, 2026. Snowfall totals are based on the 12z GFS and ECMWF model runs; shifts in the storm track or “dry slotting” could reduce totals. Power outage data is localized and subject to rapid change during severe weather. Verified data for the March 12-13 northern Minnesota blizzard was used for historical context. Unverified social media reports of “3 feet of snow” have been excluded in favor of official agency ranges.