How severe weather alerts from NOAA actually protect your home and family
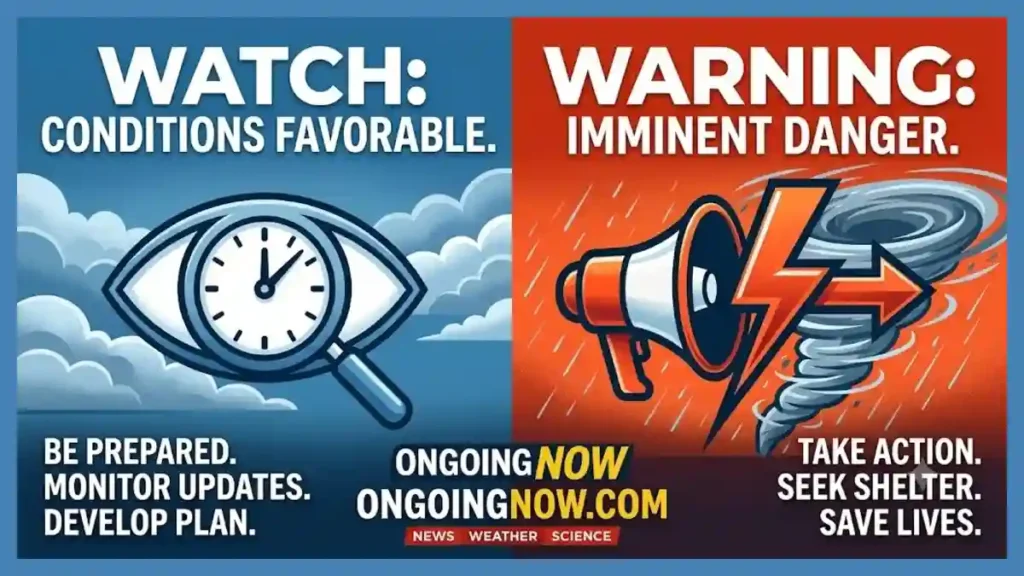
Understanding the difference between a NOAA watch and warning helps families execute severe weather alerts safety plans before hazardous systems strike.
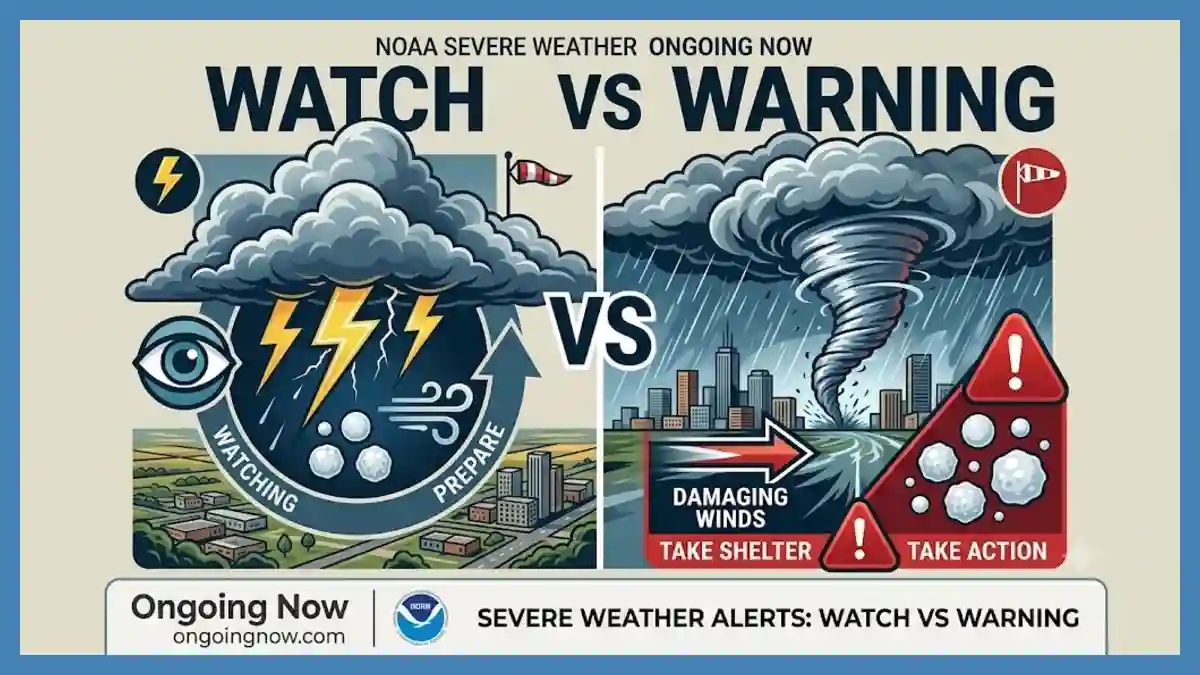
When convective systems threaten localized communities, understanding the difference between watch and warning NOAA classifications is essential for mitigating risk. Knowing exactly what to do during thunderstorm watch periods allows families to prepare before conditions deteriorate. If conditions escalate and local forecasters issue an alert matching severe thunderstorm warning criteria, immediate protective actions become necessary.
To assess hazards via a convective outlook map interpretation, individuals must evaluate specific damaging wind speed thresholds and take large hail safety precautions early. Checking severe weather alerts today near me and monitoring emergency weather radio frequencies ensures continuous situational awareness during fast-moving atmospheric hazards.
Decoding Atmospheric Alerts: The Difference Between Watch and Warning NOAA Definitions
Understanding the absolute structural difference between watch and warning NOAA frameworks forms the cornerstone of proactive emergency preparedness. The National Oceanic and Atmospheric Administration (NOAA), alongside the National Weather Service (WS), operates a precise dual-tier notification system designed to prevent confusion during high-impact atmospheric setups.
       [ CONVECTIVE DEVELOPMENT ]
                   │
                   ▼
     ┌───────────────────────────┐
     │     THUNDERSTORM WATCH     │  --> Ingredients Present (Be Prepared)
     └─────────────┬─────────────┘
                   │
                   ▼
     ┌───────────────────────────┐
     │   THUNDERSTORM WARNING    │  --> Event Occurring/Imminent (Take Action)
     └───────────────────────────┘
A severe thunderstorm watch signifies that the fundamental meteorological ingredients required to produce destructive weather are present in the atmosphere. These primary factors include high low-level moisture, structural atmospheric instability, a mechanical lifting mechanism, and strong vertical wind shear. During a watch, the Storm Prediction Center (SPC) alerts the public that severe hazards are highly possible across a broad multi-county or multi-state region over the subsequent four to eight hours.
Conversely, a severe thunderstorm warning indicates that dangerous weather is no longer just a possibility; it is imminent or actively occurring. Local National Weather Service forecast offices issue these highly localized alerts when Doppler radar identifies signature storm rotations or when ground spotters verify hazardous elements. A warning covers a highly defined polygon for a short duration, usually 30 to 60 minutes, meaning immediate protective actions are required.
“A watch means get ready because the atmospheric ingredients are there. A warning means take shelter immediately because the hazard is on your doorstep,” states Ken Graham, Director of the National Weather Service.
Technical Metrics: Severe Thunderstorm Warning Criteria and Environmental Baselines
The National Weather Service uses rigid, unambiguous parameters to declare a severe thunderstorm warning. A storm must meet or exceed at least one of these standardized criteria to be classified as severe; regular lightning and heavy downpours alone do not trigger this specific broadcast level.
The Standardized Classification Thresholds
| Hazard Element | Metric Requirement | Primary Structural Risk Profile |
| Damaging Wind Gusts | Greater than or equal to 58 mph (50 knots) | Structural damage, downed trees, localized power failures |
| Large Hail Diameter | Greater than or equal to 1.00 inch (Quarter size) | Property damage, vehicular destruction, agricultural loss |
| Tornadic Potential | Documented rotation or active funnel | Extreme threat to life, total building compromise |
Meeting these severe thunderstorm warning criteria immediately triggers an automated broadcast through the Emergency Alert System (EAS) and Wireless Emergency Alerts (WEA) on cellular networks. Atmospheric scientists monitor these developments by tracking reflectivity values and velocity changes using advanced WSR-88D dual-polarization radar networks.
Meteorologists analyze vertical thermodynamic profiles via convective available potential energy (CAPE) measurements to predict whether an environment can support severe thresholds. When CAPE values exceed 2,000 Joules per kilogram alongside steep mid-level lapse rates, updrafts rapidly intensify. These intense updrafts support heavy ice accumulation and accelerate downburst winds toward the surface.
Mapping Synoptic Hazards: Convective Outlook Map Interpretation
The Storm Prediction Center issues daily visual forecast charts detailing organized severe weather threats across the continental United States. Executing a correct convective outlook map interpretation requires an understanding of the five standardized risk categories, which scale continuously from isolated threats to widespread historical outbreaks.
Understanding the Five Core Risk Levels
Category 1 – Marginal (MRGL): Characterized by isolated severe storms that are limited in both spatial coverage and duration. Wind gusts generally hover near the baseline thresholds, and hail remains small.
Category 2 – Slight (SLGT): Implies that scattered severe thunderstorms are possible within the defined region. The storms are typically short-lived, though isolated intense supercells may develop.
Category 3 – Enhanced (ENH): Signals that severe storms will likely be more persistent, widespread, and clustered. Several intense cells capable of producing significant damage are common.
Category 4 – Moderate (MDT): Indicates widespread severe weather is likely, including long-lived storm complexes, intense damaging wind events, or localized tornado outbreaks.
Category 5 – High (HIGH): Reserved for severe, historically significant weather events. This designation forewarns of highly widespread, extremely destructive hazards, such as major derecho events or major tornado outbreaks.
When analyzing these visual forecasts, it is important to remember that the risk levels indicate coverage probability rather than the exact chronological path of an individual cell. Even a low-tier Marginal classification demands attention, as any single severe cell can produce life-threatening downbursts or large hail over a neighborhood.
Kinetic Threats: Damaging Wind Speed Thresholds and Microburst Dynamics
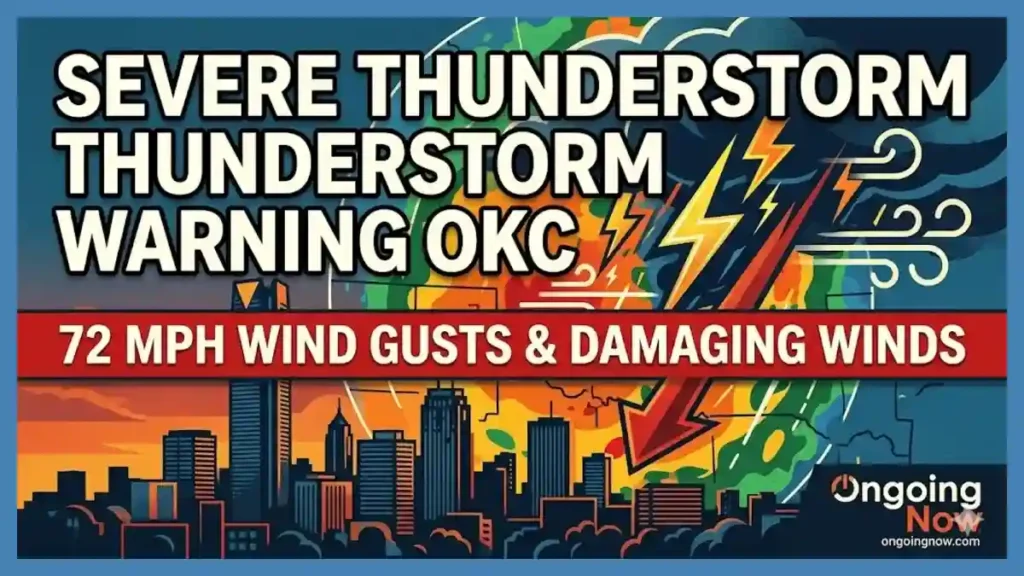
Damaging winds account for the vast majority of convective property destruction reported annually across the country. The National Weather Service separates convective wind threats into distinct categories based on documented damaging wind speed thresholds observed during active events.
[ CONVECTIVE DOWNDRAFT ] ──> [ IMPACTS SURFACE ] ──> [ RADIAL OUTFLOW (58+ MPH) ]
Straight-line winds are produced by intense, rain-cooled downdrafts that sink rapidly out of a mature thunderstorm cell. When this dense, cold air mass hits the ground, it expands radially outward with extreme force. If the horizontal velocity matches or exceeds 58 miles per hour, the system satisfies the baseline criteria for a severe weather designation.
Analysis: Straight-Line Winds vs. Tornadic Forces
Severe straight-line winds can easily equal the destructive capabilities of a weak-to-moderate tornado. A strong microburst can produce localized wind velocities exceeding 100 miles per hour, which is strong enough to lift roofs off residential structures, overturn commercial vehicles, and flatten mature forests.
Unlike tornadoes, which leave long, narrow paths of convergent, twisting debris, straight-line winds leave a divergent, linear pattern of damage pointing in a single direction.
“People often misinterpret straight-line wind damage as a tornado. In reality, a 70-mph downburst presents the exact same structural threat to a residential roof as an EF-0 tornado,” notes Dr. Harold Brooks, Senior Scientist at the National Severe Storms Laboratory (NSSL).
Impact Mitigation: Large Hail Safety Precautions and Physical Vulnerabilities
Large hail forms when exceptionally powerful convective updrafts carry liquid raindrops upward into sub-freezing layers of the troposphere. Supercooled water droplets freeze instantly upon contacting ice nuclei, forming concentric rings of ice as they circulate within the updraft core.
The Physics of Hailstone Velocity
The terminal velocity of a falling hailstone increases proportionally with its physical mass and diameter. A standard 1.00-inch quarter-sized hailstone falls at velocities between 25 and 40 miles per hour.
However, when hailstones grow to baseball size (2.75 inches) or softball size (4.00 inches), their terminal velocity can exceed 80 to 100 miles per hour. At these speeds, hail easily penetrates residential roof shingles, smashes through windshields, and causes severe blunt-force trauma to exposed individuals.
Key Protective Measures
To minimize personal and property exposure during major events, implementing clear large hail safety precautions is crucial:
Seek Substantial Indoor Shelter: Move immediately into a permanent, fully enclosed structure. Avoid lightweight carports, open tents, or covered porches, which offer no protection against high-velocity, angled hail impacts.
Protect Vulnerable Glass Areas: Move away from windows, skylights, and glass doors. Close all interior drapes, blinds, or shutters to prevent flying shards if a window breaks.
Secure Vehicles Early: If a watch is active, move vehicles into garages or sturdy underpasses. Never park beneath a highway overpass during an active storm, as this creates dangerous traffic bottlenecks and exposes you to high-wind hazards.
Actionable Readiness: What to Do During Thunderstorm Watch Phases
Proactive planning during the initial stages of atmospheric development significantly reduces vulnerability when conditions eventually worsen. Knowing exactly what to do during thunderstorm watch phases ensures you can react effectively if a warning is issued later.
                     ┌──────────────────────────────────────┐
                     │       THUNDERSTORM WATCH ACTIVE      │
                     └──────────────────┬───────────────────┘
                                        │
         ┌──────────────────────────────┼──────────────────────────────┐
         ▼                              ▼                              ▼
┌──────────────────┐          ┌──────────────────┐          ┌──────────────────┐
│ REVIEW PLANS     │          │ CHARGE DEVICES   │          │ SECURE PROPERTY  │
│ Locate shelter   │          │ Phones, backups, │          │ Bring items inside│
│ zones inside     │          │ emergency radios │          │ close structures │
└──────────────────┘          └──────────────────┘          └──────────────────┘
First, review your family emergency plan and identify your designated interior safe room, such as a basement, cellar, or a central windowless room on the lowest floor. Ensure all household members know where to gather if conditions deteriorate.
Next, check your emergency supply kit. Verify that you have fresh batteries, a first aid kit, flashlights, and a multi-day supply of water and non-perishable food. Charge all mobile phones and auxiliary power banks to ensure open communication channels if regional power grids fail.
Finally, secure your property by bringing outdoor furniture, garbage cans, and loose tools inside. These everyday items can easily become dangerous airborne projectiles in 60-mph straight-line winds. Additionally, check on vulnerable neighbors or family members who live nearby to ensure their safety plans are ready.
Redundant Communications: Emergency Weather Radio Frequencies and Local Monitored Alerts
Relying on a single communication method during severe weather introduces an unnecessary point of failure. Cellular towers can be damaged by wind, networks can become overloaded, and power outages can disable standard home internet systems.
“Redundancy saves lives. If your phone is your only way to get a warning, you are exposed if a tower goes down or your battery dies overnight,” warns the NOAA National Weather Service Preparedness Division.
Maintaining an operational NOAA Weather Radio (NWR) equipped with a Public Alert icon provides an independent, reliable backup. These specialized receivers operate on a dedicated VHF network that bypasses commercial infrastructure, broadcasting continuous weather hazards directly from local forecast offices.
Primary NOAA Weather Radio Broadcast Channels
| Frequency Band | Channel Designation | Typical Regional Broadcast Coverage |
| 162.400 MHz | Channel 1 | Widespread regional transmitter coverage |
| 162.425 MHz | Channel 2 | Secondary metropolitan/rural links |
| 162.450 MHz | Channel 3 | Localized topography repeaters |
| 162.475 MHz | Channel 4 | Alternate regional network arrays |
| 162.500 MHz | Channel 5 | Standard multi-county broadcast points |
| 162.525 MHz | Channel 6 | Secondary rural coverage networks |
| 162.550 MHz | Channel 7 | Primary baseline regional transmitter |
These receivers include Specific Area Message Encoding (SAME) technology, allowing users to program their exact county code. This filters out distant warnings and ensures the internal siren only sounds for local threats.
Alongside setting up a weather radio, configure your mobile phone to receive both wireless emergency alerts and local emergency notifications. Regularly checking severe weather alerts today near me through official platforms ensures you stay aware of rapidly changing conditions in your area.
Long-Term Trends: Climatological Shifts in Severe Convective Activity
Why This Matters: Changing Risk Patterns
Long-term climate data reveals noticeable shifts in how severe convective storms behave across North America. While the total number of severe weather days per year has remained relatively flat over the past few decades, the concentration and geographic distribution of these events are shifting.
Researchers at the National Center for Atmospheric Research (NCAR) have documented a eastward shift in traditional storm environments. The high-frequency zone for severe convective activity is expanding from the traditional Great Plains toward the more densely populated Mississippi, Ohio, and Tennessee River Valleys.
Furthermore, long-term climate models show a trend toward higher-variability severe weather seasons. This means we see more quiet periods broken up by highly concentrated, hyper-active clusters of severe weather days.
As regional temperatures and atmospheric moisture levels continue to rise, the energy available to fuel powerful convective storms increases. This expansion of high-energy environments highlights the growing importance of understanding official warning systems to maintain community safety year-round.
Stay sharp with Ongoing Now!
Source and Data Limitations: The analysis and guidelines detailed across this article rely strictly on official meteorological frameworks maintained by the National Oceanic and Atmospheric Administration (NOAA), the National Weather Service (NWS), and the Storm Prediction Center (SPC). Baseline warning thresholds and convective category criteria are accurate as of the current 2026 operational standards. Local alert delivery timeframes, radar visibility limits, and cellular broadcast reliability can vary based on regional topography, telecommunications infrastructure, and specific local NWS office protocols. Long-term climate trend insights are synthesized from peer-reviewed historical studies compiled by the National Center for Atmospheric Research (NCAR) and the National Severe Storms Laboratory (NSSL). Unverified citizen reports, non-peer-reviewed long-range climate models, and short-term private smartphone radar predictions were excluded to preserve absolute accuracy and editorial integrity.