Geopolitical Risk and Investment: Market Impacts
Analyze how geopolitical risk and investment strategies shift as Middle East tensions impact the Dow Jones and global energy prices.

Middle East geopolitical risk and investment strategies have become central to global market discourse following a series of military strikes on March 2, 2026. Global equity indices, including the Dow Jones Industrial Average and the S&P 500, experienced notable volatility as investors reacted to potential supply chain disruptions and a spike in energy costs. The conflict, centered on the Strait of Hormuz, has directly impacted crude oil prices and heightened inflation expectations for the remainder of 2026. Consequently, market participants are increasingly pivoting toward defensive investing during geopolitical conflict, seeking stability in precious metals like gold and the Swiss Franc. These developments underscore the sensitivity of modern portfolios to sudden geopolitical shocks and the critical role of energy security in corporate valuations.
Market Performance and the Dow Jones Industrial Average
The stock market opened the first Monday of March 2026 under significant downward pressure. The Dow Jones Industrial Average (DJIA) fell 521.28 points, or 1.1%, to close at 48,977.92. While 18 components of the 30-stock index managed to finish in positive territory, the overall index was weighed down by heavy losses in the financial and technology sectors.
Market analysts attribute the Dow Jones plummeting reasons to a combination of high-altitude geopolitical tension and lingering concerns over artificial intelligence (AI) monetization. On the NYSE, decliners outnumbered advancers by a 1.31-to-1 ratio, reflecting a broad-based “risk-off” sentiment.
Benchmarks at a Glance: March 2, 2026
| Index | Closing Value | Change (Points) | Change (%) |
| Dow Jones Industrial Average | 48,977.92 | -521.28 | -1.1% |
| S&P 500 | 6,878.90 | -29.98 | -0.4% |
| Nasdaq Composite | 22,668.21 | -210.17 | -0.9% |
| CBOE Volatility Index (VIX) | 19.86 | +1.23 | +6.6% |
“Investor sentiment remains fragile as traders grapple with persistent macroeconomic and geopolitical concerns,” noted a market update from Zacks Investment Research. “Hotter-than-expected producer-side inflation numbers also kept investors on edge.”
The Middle East War Impact on Stocks
The primary catalyst for the current volatility is the Iran-Israel conflict financial news. Following joint military strikes by the United States and Israel on Iranian facilities over the weekend, the stock market response to war was immediate. The escalation followed reports concerning the death of Iran’s Supreme Leader, which triggered retaliatory drone and missile strikes across the region.
The Middle East war impact on stocks is most visible in the energy and defense sectors. While the broader market retreated, the Energy Select Sector SPDR (XLE) advanced 1.7%, as investors anticipated higher margins for domestic oil producers. Conversely, multinational corporations with significant exposure to global trade routes faced increased selling pressure due to the threat of maritime instability.
Why Is the Market Down Today?
Investors are asking: why is the market down today? The answer lies in the intersection of energy costs and corporate overhead.
Energy Prices: Higher fuel costs act as a “tax” on both consumers and corporations, reducing discretionary spending and increasing logistics costs.
Uncertainty: Markets dislike ambiguity; the lack of a clear timeline for the de-escalation of the Iran-Israel conflict has led to a spike in the VIX “fear gauge.”
Inflationary Pressure: A sustained energy price spike impact on S&P 500 companies could force central banks to maintain higher interest rates for longer, further discounting future corporate earnings.
Strait of Hormuz Oil Supply Disruption and Energy Markets
A critical factor in the current economic landscape is the Strait of Hormuz oil supply disruption. This 21-mile-wide waterway is the world’s most vital maritime chokepoint, facilitating the passage of approximately 20% of the world’s daily oil supply and 20% of global liquefied natural gas (LNG).
Reports on March 2 indicated that Iran’s Revolutionary Guard warned tankers away from the waterway, effectively halting a significant portion of traffic. According to Wood Mackenzie, this creates a “dual supply shock” because not only are current exports halted, but the spare capacity of OPEC+ nations—typically used to balance the market—is also inaccessible behind the blockade.
Crude Oil Performance
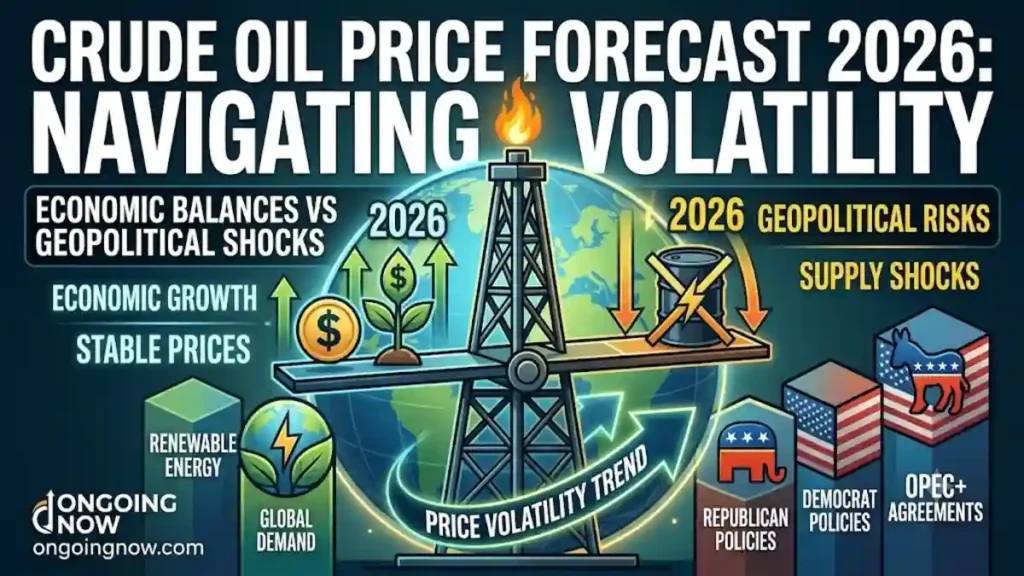
The crude oil inflation correlation was on full display as Brent crude futures jumped 8.34% to $78.95 per barrel, while West Texas Intermediate (WTI) rose over 7% to settle above $71. Analysts from Barclays warned that a prolonged closure could see prices test the $100 per barrel threshold, a level not seen since the shocks of 2022.
Why Rising Oil Hurts Tech Stocks
The relationship between why rising oil hurts tech stocks is rooted in the “cost of capital” theory. Technology companies, particularly those in the high-growth software and semiconductor sub-sectors, are valued based on the present value of their future cash flows.
When oil prices spike, it fuels inflation expectations 2026, which in turn keeps Treasury yields elevated. As yields rise, the “discount rate” applied to future earnings increases, making high-valuation tech stocks less attractive today.
Salesforce, Inc. (CRM): Declined 2.4% on March 2.
Microsoft Corporation (MSFT): Fell 2.2% during the same session.
Semiconductors: Lead the retreat as traders questioned if AI demand could justify valuations amid rising operational costs.
The commodity price vs stock market inverse relationship is currently dominated by energy. While energy stocks rise, the broader S&P 500 faces headwinds as the “input costs” for almost every other sector—from manufacturing to cloud computing—begin to climb.
Geopolitical Risk and Investment: Defensive Strategies
In response to the geopolitical shock economic analysis, institutional and retail investors are seeking refuge in safe-haven assets 2026. Diversification has moved beyond simple stock-bond splits to include “hard” assets that hold value during periods of currency or regional instability.
Buying Gold During War
The tradition of buying gold during war has seen a massive resurgence. Gold spot prices climbed 2.3% on March 2, reaching $5,408.26 per ounce. This follows a year-long rally where gold surged past $5,000 in January 2026.
Portfolio Protection Strategies Volatility
Precious Metals: Diversifying with precious metals is a primary tactic. Gold and silver (up 3.2% in weekend trading) provide a hedge against fiat currency devaluation.
Currency Hedging: Hedging stocks with Swiss Franc (CHF) is common due to Switzerland’s historical neutrality and fiscal stability. The Franc often appreciates when the Euro or US Dollar faces geopolitical uncertainty.
Defensive Investing: Investors are rotating into Consumer Staples and Health Care, sectors that provide essential services regardless of the global political climate.
“A prolonged period of high oil prices would push global inflation higher and growth lower, potentially shifting monetary policy expectations,” stated a market update from Barclays Private Bank.
Economic and Policy Implications
The geopolitical risk and investment landscape is also being shaped by central bank reactions. The International Monetary Fund (IMF) and the Bank of International Settlements (BIS) have noted that while global growth was projected at 3.3% for 2026, an escalation in the Middle East represents a significant “downside risk.”
Inflation expectations 2026 are being recalibrated. If the Strait of Hormuz remains restricted for more than a few weeks, the “imported inflation” from energy and freight costs could force the Federal Reserve and the European Central Bank to pause planned rate cuts. This would further pressure the equity markets, particularly those sensitive to borrowing costs.
What the Numbers Show: Safe Haven Performance
| Asset | Current Price/Value | 1-Day Change (%) |
| Gold (Spot) | $5,408.26/oz | +2.3% |
| Silver (Spot) | $93.83/oz | +1.26% |
| US Dollar Index (DXY) | 97.83 | +0.22% |
| Swiss Franc (vs USD) | 0.8650 | +0.45% |
Human and Societal Impact
Beyond the tickers and tables, the Middle East war impact on stocks reflects a deeper concern for global stability. For consumers, the immediate effect is felt at the fuel pump. In the UK, the AA reported that petrol prices have already begun to rise, a trend likely to be mirrored in the US as wholesale crude costs filter through the supply chain.
In import-dependent economies like India, the Sensex fall of over 1,200 points highlights the vulnerability of emerging markets to energy shocks. Higher oil prices deplete foreign exchange reserves and squeeze corporate margins for manufacturers, leading to potential slowdowns in industrial production.
Analysis: The Long-Term Outlook
The stock market response to war typically follows a pattern of an initial “shock” followed by a period of “adjustment.” If the conflict remains contained, markets often recover as supply chains find alternative routes (such as the Cape of Good Hope). However, the 2026 crisis is unique due to the simultaneous pressure on the AI-tech narrative and the scale of the Strait of Hormuz disruption.
Investors are advised to remain focused on portfolio protection strategies volatility by maintaining a balanced exposure to both growth and defensive assets. While how to trade gold spot price effectively requires attention to daily headlines, the broader strategy of defensive investing during geopolitical conflict remains the most prudent approach for long-term capital preservation.
Stay sharp with Ongoing Now!
Source and Data Limitations: This report is based on market data provided by the New York Stock Exchange (NYSE), Zacks Investment Research, and Reuters as of March 2, 2026. Commodity pricing, including gold spot prices and Brent crude futures, was verified through Priority Gold and S&P Global Commodities at Sea. Geopolitical developments regarding the Strait of Hormuz were sourced from official statements via the International Energy Agency (IEA) and Wood Mackenzie. Historical comparisons utilize IMF World Economic Outlook data from January 2026. This article does not include speculative forecasts or investment advice; all performance metrics reflect realized market movements as of the publication timestamp. Some real-time data may be subject to standard exchange delays.